
Bestand:Younger dryas 1.jpg

Oorspronkelijk bestand (1.600 × 766 pixels, bestandsgrootte: 343 kB, MIME-type: image/jpeg)
| Dit is een bestand van Wikimedia Commons. Onderstaande beschrijving komt van de beschrijving van het bestand daar. |
Beschrijving
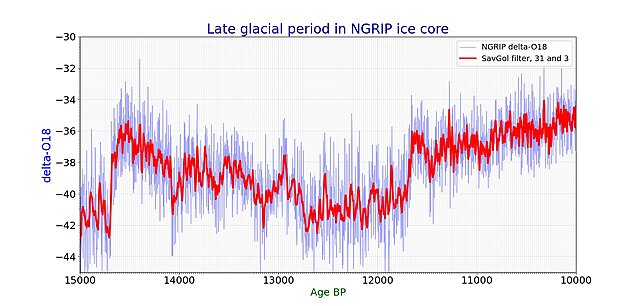
| Beschrijving | Younger Dryas cold event seen in NGRIP curve, time goes from right to left. Numbers are thousand of years ago in NGRIP time scale. Down is colder, up is warmer. |
| Datum | 3.12.2007 |
| Bron | Eigen werk |
| Auteur | Merikanto |
Licentie
| Ik, de auteursrechthebbende van dit werk, geef dit werk vrij in het publieke domein. Dit is wereldwijd van toepassing. In sommige landen is dit wettelijk niet mogelijk; in die gevallen geldt: Ik sta iedereen toe dit werk voor eender welk doel te gebruiken, zonder enige voorwaarden, tenzij zulke voorwaarden door de wet worden voorgeschreven. |
Assitional information
Data for this file is from http://www.iceandclimate.nbi.ku.dk/data/NGRIP_d18O_and_dust_5cm.xls http://www.iceandclimate.nbi.ku.dk/data/ processed to csv
δ18O values and dust concentrations
The dataset provides NGRIP δ18O
values, dust concentrations, and GICC05 ages in 5cm depth resolution for the
period 0-60 ka (δ18O) and 10-60 ka (dust).
The dataset accompany the following papers:
NGRIP members, Nature, 431, 147-151, 2004. DOI: 10.1038/nature02805
Gkinis et al., Earth Planet. Sci. Lett., 405, 132-141, 2014.  DOI:
10.1016/j.epsl.2014.08.022
Ruth et al., J. Geophys. Res., 108, 4098, 2003. DOI: 4010.1029/2002JD002376
- drawing climate diagram in python 3
- version 2.11
- 11.9.2020
-
import matplotlib.pyplot as plt
import numpy as np
import pandas as pd
from scipy import interpolate
from matplotlib.ticker import (MultipleLocator, AutoMinorLocator)
import scipy.signal
def running_mean(x, N):
   cumsum = np.cumsum(np.insert(x, 0, 0))
   return (cumsum[N:] - cumsum[:-N]) / float(N)
datafilename="ngrip1.csv"
captioni="Late glacial period in NGRIP ice core"
savename="ngrip_dryas.svg"
figsizex=16
figsizey=8
- x = []
- y = []
- y2= []
dfin0=pd.read_csv(datafilename, sep=";")
lst1=['gicc05_age','delta_O18']
dfin1 = dfin0[dfin0.columns.intersection(lst1)]
x0=dfin1['gicc05_age']
y0=dfin1['delta_O18']
- y20=dfin1['GISP_dO18']
- y30=dfin1['GISP2_dO18']
x=np.array(x0)
y=np.array(y0)
- y2=np.array(y20)
- y3=np.array(y30)
- list1=[]
- list1.append(y)
- list1.append(y2)
- list1.append(y3)
- data1=np.array(list1)
- print (np.shape(data1))
- data_avg1=np.average(data1, axis=0)
- print(x)
- print(y)
- quit(0)
size0=14
size1=16
size2=18
size3=24


y_savgol = scipy.signal.savgol_filter(y,31, 3)
- y_running = running_mean(y, 31)
x_sm = np.array(x)
y_sm = np.array(y)
x_smooth = np.linspace(x_sm.min(), x_sm.max(), 20000)
funk1 = interpolate.interp1d(x_sm, y_sm, kind="cubic")
y_smooth = funk1(x_smooth)


fig, ax1 = plt.subplots()
- ax1.axis((11600,14000,0,ymax1))
ax1.set_xlim(10000,15000)
ax1.set_ylim(-30.0, -45.0)
plt.gca().invert_xaxis()
plt.gca().invert_yaxis()
ax1.set_ylabel('delta-O18', color='#0000ff', fontsize=size2+2)


ax1.plot(x,y, color="#a0a0ff", linewidth=1,label="NGRIP delta-O18")
- ax1.plot(x_smooth,y_smooth, color="#0000ff", linewidth=3,label="NGRIP delta-O18")
ax1.plot(x,y_savgol, color="#FF0000", linewidth=3, label="SavGol filter, 31 and 3")
- ax1.plot(x,y_running, color="#FF0000", linewidth=3)
- ax1.plot(x,data_avg1, color="#ff0000", linewidth=2, linestyle=":", label="Average of NGRIP, GISP, GISP2 delta-O18")
ax1.tick_params(axis='both', which='major', labelsize=size2)
ax1.xaxis.set_minor_locator(MultipleLocator(100))
ax1.xaxis.set_minor_locator(MultipleLocator(20))
ax1.yaxis.set_minor_locator(MultipleLocator(1.0))
ax1.yaxis.set_minor_locator(MultipleLocator(0.1))
ax1.grid(which='major', linestyle='-', linewidth='0.1', color='black')
ax1.grid(which='minor', linestyle=':', linewidth='0.1', color='black')


ax1.set_xlabel('Age BP', color="darkgreen", fontsize=size2)


ax1.set_title(captioni, fontsize=size3, color="#0000af")
plt.legend(fontsize=size0)
fig = plt.gcf()
fig.set_size_inches(figsizex, figsizey, forward=True)


plt.savefig(savename, format="svg", dpi = 100)
plt.show()
Bestandsgeschiedenis
Klik op een datum/tijd om het bestand te zien zoals het destijds was.
| Datum/tijd | Miniatuur | Afmetingen | Gebruiker | Opmerking | |
|---|---|---|---|---|---|
| huidige versie | 12 sep 2020 18:38 | | 1.600 × 766 (343 kB) | Merikanto | New data and better layout |
| 10 aug 2008 12:12 |  | 860 × 640 (44 kB) | Merikanto~commonswiki | {{Information |Description=Younger dryas age NGRIP delta-018 oxygen isotope data curve. X- axis time before past, y-axis delta-O18. that is depended on temperature, up is warmer, down is colder. Based on NGRIP data file. NGRIP_d18O_50yrs.txt, that is Supp | |
| 3 dec 2007 22:57 |  | 885 × 671 (155 kB) | Merikanto~commonswiki | {{Information |Description=Younger Dryas cold event seen in NGRIP curve, time goes from right to left. Numbers are thousand of years ago in NGRIP time scale. Down is colder, up is warmer. |Source=self-made |Date=3.12.2007 |Author= [[User:Merikanto|Merikan |
Bestandsgebruik
Dit bestand wordt op de volgende pagina gebruikt:
Globaal bestandsgebruik
De volgende andere wiki's gebruiken dit bestand:
- Gebruikt op fi.wikipedia.org