
Bestand:Vapor Pressure Chart.png
Geen hogere resolutie beschikbaar.
Vapor_Pressure_Chart.png (301 × 397 pixels, bestandsgrootte: 9 kB, MIME-type: image/png)
| Dit is een bestand van Wikimedia Commons. Onderstaande beschrijving komt van de beschrijving van het bestand daar. |
Beschrijving
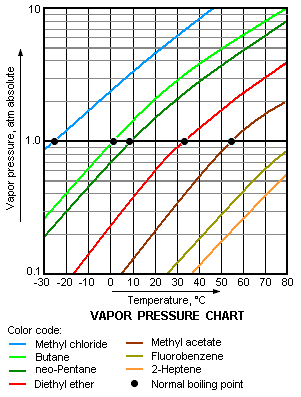
| Beschrijving | This image is a chart of vapor pressure versus temperature, for various liquids. The chart's y-axis is logarithmic and the x-axis is linear. It includes data for propane|, methyl chloride, butane, neo-pentane, diethyl ether, methyl acetate, fluorobenzene, and 2-heptene. | |||
| Datum | ||||
| Bron | Eigen werk | |||
| Auteur | Mbeychok | |||
| Andere versies |
|


Licentie
| Ik, de auteursrechthebbende van dit werk, geef dit werk vrij in het publieke domein. Dit is wereldwijd van toepassing. In sommige landen is dit wettelijk niet mogelijk; in die gevallen geldt: Ik sta iedereen toe dit werk voor eender welk doel te gebruiken, zonder enige voorwaarden, tenzij zulke voorwaarden door de wet worden voorgeschreven. |
Bestandsgeschiedenis
Klik op een datum/tijd om het bestand te zien zoals het destijds was.
| Datum/tijd | Miniatuur | Afmetingen | Gebruiker | Opmerking | |
|---|---|---|---|---|---|
| huidige versie | 15 sep 2015 15:00 | | 301 × 397 (9 kB) | Обедающий философ | Reverted to version as of 20:45, 6 March 2012 (cos Materialscientist cannot into resize) |
| 11 jun 2014 02:03 |  | 400 × 528 (8 kB) | Materialscientist | scaling issues | |
| 6 mrt 2012 22:45 |  | 301 × 397 (9 kB) | Mbeychok | Added normal boiling points to the chart. | |
| 12 okt 2007 05:21 |  | 301 × 397 (9 kB) | Mbeychok | I am the original author and uploader of the existing Vapor Pressure Chart.png. I had to remove a short line segment that I had failed to erase. | |
| 12 okt 2007 05:14 |  | 301 × 397 (9 kB) | Mbeychok | This is an improved version of the existing Image:Vapor Pressure Chart.png which has been slightly modified and I am the original author and uploader of the existing image. | |
| 6 okt 2007 21:52 |  | 301 × 397 (9 kB) | Mbeychok | Made a minor correction/revision to this image file which I uploaded yesterday.This is the revised version. - ~~~~ | |
| 6 okt 2007 06:38 |  | 301 × 397 (9 kB) | Mbeychok | {{Information |Description= This image is a chart of vapor pressure versus temperature, for various liquids. The chart's y-axis if logarithmic and the x-axis is linear. |Source=self-made |Date=October 5, 2007 |Author= Mbeychok }} |
Bestandsgebruik
Dit bestand wordt op de volgende pagina gebruikt:
Globaal bestandsgebruik
De volgende andere wiki's gebruiken dit bestand:
- Gebruikt op ar.wikipedia.org
- Gebruikt op bn.wikipedia.org
- Gebruikt op ca.wikipedia.org
- Gebruikt op en.wikipedia.org
- Gebruikt op et.wikipedia.org
- Gebruikt op fa.wikipedia.org
- Gebruikt op fr.wikipedia.org
- Gebruikt op he.wikipedia.org
- Gebruikt op hr.wikipedia.org
- Gebruikt op hu.wikipedia.org
- Gebruikt op id.wikipedia.org
- Gebruikt op ja.wikipedia.org
- Gebruikt op mk.wikipedia.org
- Gebruikt op ml.wikipedia.org
- Gebruikt op no.wikipedia.org
- Gebruikt op pl.wikipedia.org
- Gebruikt op sh.wikipedia.org
- Gebruikt op sl.wikipedia.org
- Gebruikt op sr.wikipedia.org
- Gebruikt op sv.wikipedia.org
- Gebruikt op ur.wikipedia.org