
Bestand:2010–11 South Pacific cyclone season summary.png

Grootte van deze voorvertoning: 800 × 500 pixels. Andere resoluties: 320 × 200 pixels | 640 × 400 pixels | 1.024 × 640 pixels | 1.280 × 800 pixels | 2.560 × 1.600 pixels | 4.000 × 2.500 pixels.
Oorspronkelijk bestand (4.000 × 2.500 pixels, bestandsgrootte: 587 kB, MIME-type: image/png)
| Dit is een bestand van Wikimedia Commons. Onderstaande beschrijving komt van de beschrijving van het bestand daar. |
| Beschrijving |
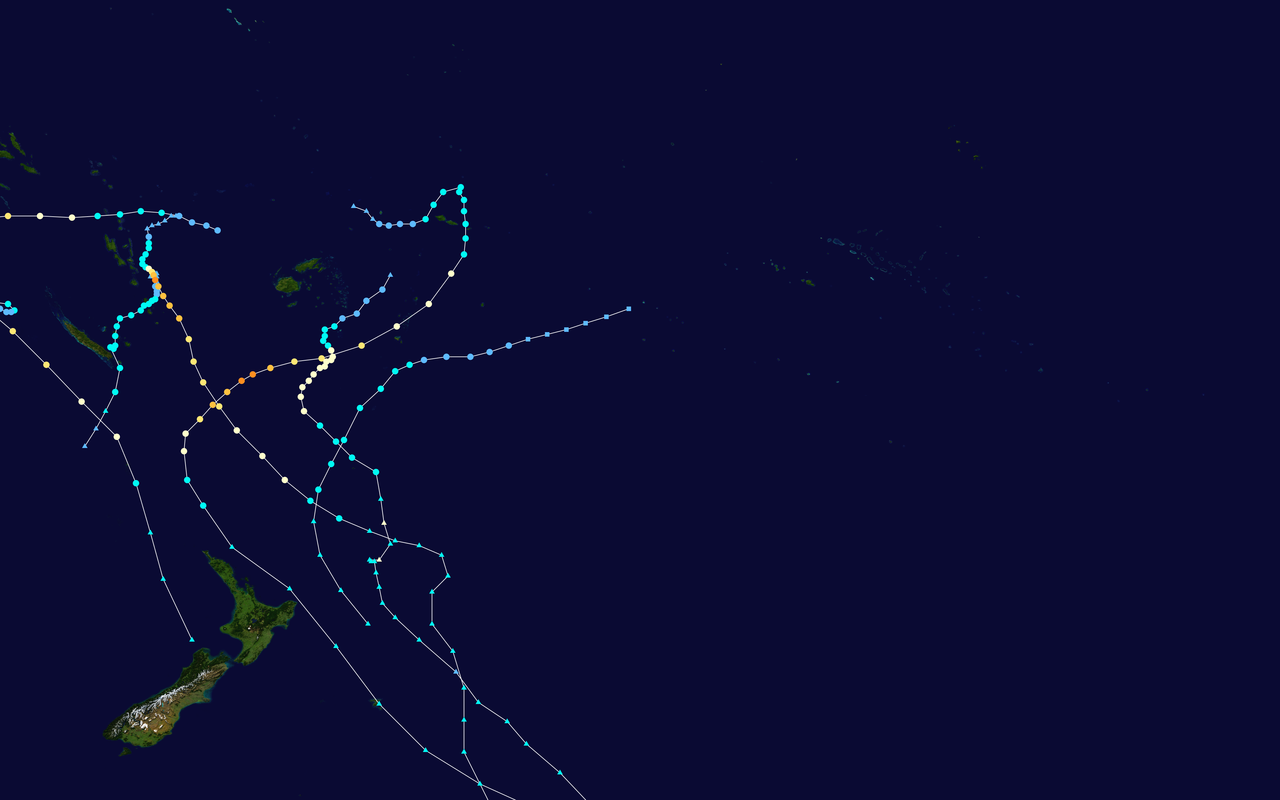
English: This map shows the tracks of all tropical cyclones in the 2010-11 South Pacific cyclone season. The points show the location of each storm at 6-hour intervals. The colour represents the storm's maximum sustained wind speeds as classified in the Saffir-Simpson Hurricane Scale (see below), and the shape of the data points represent the type of the storm.
Tropical depression (≤38 mph, ≤62 km/h)
Tropical storm (39–73 mph, 63–118 km/h)
Category 1 (74–95 mph, 119–153 km/h)
Category 2 (96–110 mph, 154–177 km/h)
Category 3 (111–129 mph, 178–208 km/h)
Category 4 (130–156 mph, 209–251 km/h)
Category 5 (≥157 mph, ≥252 km/h)
Unknown
Storm type |
| Bron | Created using Wikipedia:WikiProject Tropical cyclones/Tracks. The background image is from NASA [1]. The tracking data is from the Joint Typhoon Warning Center's best track database |
| Auteur | Keith Edkins |
| Dit werk vrijgegeven in het publieke domein door de auteur, Keith Edkins. Dit is wereldwijd van toepassing. In sommige landen is dit wettelijk niet mogelijk; in die gevallen geldt: Keith Edkins staat iedereen toe dit werk voor eender welk doel te gebruiken, zonder enige voorwaarden, tenzij zulke voorwaarden door de wet worden voorgeschreven. |
Bestandsgeschiedenis
Klik op een datum/tijd om het bestand te zien zoals het destijds was.
| Datum/tijd | Miniatuur | Afmetingen | Gebruiker | Opmerking | |
|---|---|---|---|---|---|
| huidige versie | 6 jun 2020 22:36 | | 4.000 × 2.500 (587 kB) | Supportstorm | Best track update (removed minor systems without best track data) |
| 26 feb 2011 15:39 |  | 3.000 × 2.261 (772 kB) | Keith Edkins | Updated with Atu | |
| 20 feb 2011 18:54 |  | 3.000 × 2.459 (707 kB) | Cyclonebiskit | updated | |
| 6 feb 2011 19:28 |  | 3.000 × 2.261 (512 kB) | Iune | update and higher resolution | |
| 5 feb 2011 17:47 |  | 3.000 × 2.367 (943 kB) | Keith Edkins | Include final point for Zelia | |
| 5 feb 2011 12:32 |  | 3.000 × 2.367 (939 kB) | Keith Edkins | Updated up to Pacific phase of Yasi | |
| 25 jan 2011 15:19 |  | 3.000 × 2.327 (691 kB) | Cyclonebiskit | update | |
| 22 jan 2011 23:01 |  | 3.000 × 2.327 (696 kB) | Cyclonebiskit | updated; please update your data on the previous storms and add ET points where there exist | |
| 18 jan 2011 22:56 |  | 3.000 × 1.913 (1,19 MB) | Keith Edkins | Update up to end of Zelia | |
| 16 jan 2011 21:28 |  | 3.000 × 1.854 (888 kB) | Cyclonebiskit | update (use --res 3000) |
Bestandsgebruik
Dit bestand wordt op de volgende pagina gebruikt:
Globaal bestandsgebruik
De volgende andere wiki's gebruiken dit bestand:
- Gebruikt op en.wikipedia.org
- Gebruikt op ko.wikipedia.org
- Gebruikt op pt.wikipedia.org
- Gebruikt op ru.wikipedia.org
- Gebruikt op www.wikidata.org
- Gebruikt op zh.wikipedia.org