
Bestand:Milankovitch Variations.png
Milankovitch_Variations.png (479 × 363 pixels, bestandsgrootte: 32 kB, MIME-type: image/png)
| Dit is een bestand van Wikimedia Commons. Onderstaande beschrijving komt van de beschrijving van het bestand daar. |
Beschrijving
| Beschrijving |
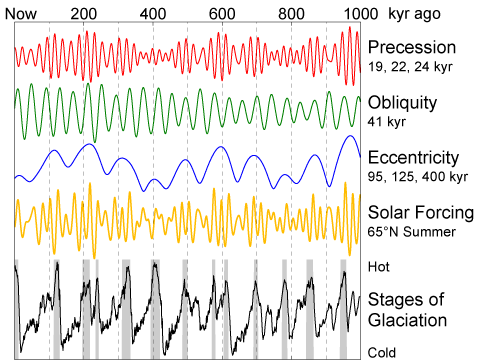
English: This figure shows the variations in Earth's orbit, the resulting changes in solar energy flux at high latitude, and the observed glacial cycles.
According to Milankovitch Theory, the precession of the equinoxes and the apsides, variations in the tilt of the Earth's axis (obliquity) and changes in the eccentricity of the Earth's orbit are responsible for causing the observed 100 kyr cycle in ice ages by varying the amount of sunlight received by the Earth at different times and locations, particularly high northern latitude summer. These changes in the Earth's orbit are the predictable consequence of interactions between the Earth, its moon, and the other planets. The orbital data shown are from Quinn et al. (1991). Principal frequencies for each of the three kinds of variations are labeled. The solar forcing curve (aka "insolation") is derived from July 1st sunlight at 65 °N latitude according to Jonathan Levine's insolation calculator [1]. The glacial data are from Lisiecki and Raymo (2005) and gray bars indicate interglacial periods, defined here as deviations in the 5 kyr average of at least 0.8 standard deviations above the mean. |
| Datum | 11 februari 2006 (uploaddatum) |
| Bron | Eigen werk |
| Auteur | This image was produced by Robert A. Rohde from publicly available data, and is incorporated into the Global Warming Art project. |
| Andere versies | Afgeleide werken van dit bestand: Variacions de Milankovitch.png |
References
- Lisiecki, L. E., and M. E. Raymo (2005), "A Pliocene-Pleistocene stack of 57 globally distributed benthic δ18O records." Paleoceanography 20, PA1003, doi:10.1029/2004PA001071 (alternative full text link: [2]).
- Quinn, T. R., S. Tremaine, and M. Duncan (1991), "A Three Million Year Integration of the Earth's Orbit." The Astronomical Journal 101, pp. 2287-2305, doi:10.1086/115850.

|
Deze grafiek zou opnieuw moeten worden aangemaakt als een SVG-bestand door vectorafbeeldingen te gebruiken. Dit heeft een aantal voordelen; zie Commons:Media for cleanup voor meer informatie. Als er een SVG-formaat van deze afbeelding bestaat, dan deze graag uploaden. Nadat u dit heeft gedaan, gelieve dit sjabloon te vervangen door het sjabloon {{vector version available|nieuwe bestandsnaam.svg}} op deze afbeeldingspagina.
|
Licentie

|
Toestemming wordt verleend voor het kopiëren, verspreiden en/of wijzigen van dit document onder de voorwaarden van de GNU-licentie voor vrije documentatie, versie 1.2 of enige latere versie als gepubliceerd door de Free Software Foundation; zonder Invariant Sections, zonder Front-Cover Texts, en zonder Back-Cover Texts. Een kopie van de licentie is opgenomen in de sectie GNU-licentie voor vrije documentatie. |
| Dit bestand is gelicenseerd onder de Creative Commons-licentie Naamsvermelding-Gelijk delen 3.0 Unported | ||
| ||
| Deze licentietag is toegevoegd aan dit bestand in verband met de GFDL licentie-update. |
Bestandsgeschiedenis
Klik op een datum/tijd om het bestand te zien zoals het destijds was.
| Datum/tijd | Miniatuur | Afmetingen | Gebruiker | Opmerking | |
|---|---|---|---|---|---|
| huidige versie | 11 feb 2006 13:35 | | 479 × 363 (32 kB) | David Legrand | == Description == This figure shows the variations in Earth's orbit, the resulting changes in solar energy flux at high latitude, and the observed glacial cycles. According to Milankovitch Theory, the precession of the [[ |
Bestandsgebruik
Dit bestand wordt op de volgende 4 pagina's gebruikt:
Globaal bestandsgebruik
De volgende andere wiki's gebruiken dit bestand:
- Gebruikt op af.wikipedia.org
- Gebruikt op ar.wikipedia.org
- Gebruikt op be.wikipedia.org
- Gebruikt op bg.wikipedia.org
- Gebruikt op ca.wikipedia.org
- Gebruikt op da.wikipedia.org
- Gebruikt op de.wikipedia.org
- Gebruikt op de.wikiversity.org
- Gebruikt op el.wikipedia.org
- Gebruikt op en.wikipedia.org
- Gebruikt op es.wikipedia.org
- Gebruikt op fa.wikipedia.org
- Gebruikt op fi.wikipedia.org
- Gebruikt op fr.wikipedia.org
- Gebruikt op fy.wikipedia.org
- Gebruikt op gl.wikipedia.org
- Gebruikt op hu.wikipedia.org
- Gebruikt op hy.wikipedia.org
- Gebruikt op id.wikipedia.org
- Gebruikt op ja.wikipedia.org
- Gebruikt op ko.wikipedia.org
- Gebruikt op no.wikipedia.org
- Gebruikt op pl.wikipedia.org
Globaal gebruik van dit bestand bekijken.