
Bestand:2014-2015 South Pacific cyclone season summary.png
Grootte van deze voorvertoning: 800 × 500 pixels. Andere resoluties: 320 × 200 pixels | 640 × 400 pixels | 1.024 × 640 pixels | 1.280 × 800 pixels | 2.560 × 1.600 pixels | 4.000 × 2.500 pixels.
Oorspronkelijk bestand (4.000 × 2.500 pixels, bestandsgrootte: 533 kB, MIME-type: image/png)
| Dit is een bestand van Wikimedia Commons. Onderstaande beschrijving komt van de beschrijving van het bestand daar. |
| Beschrijving |
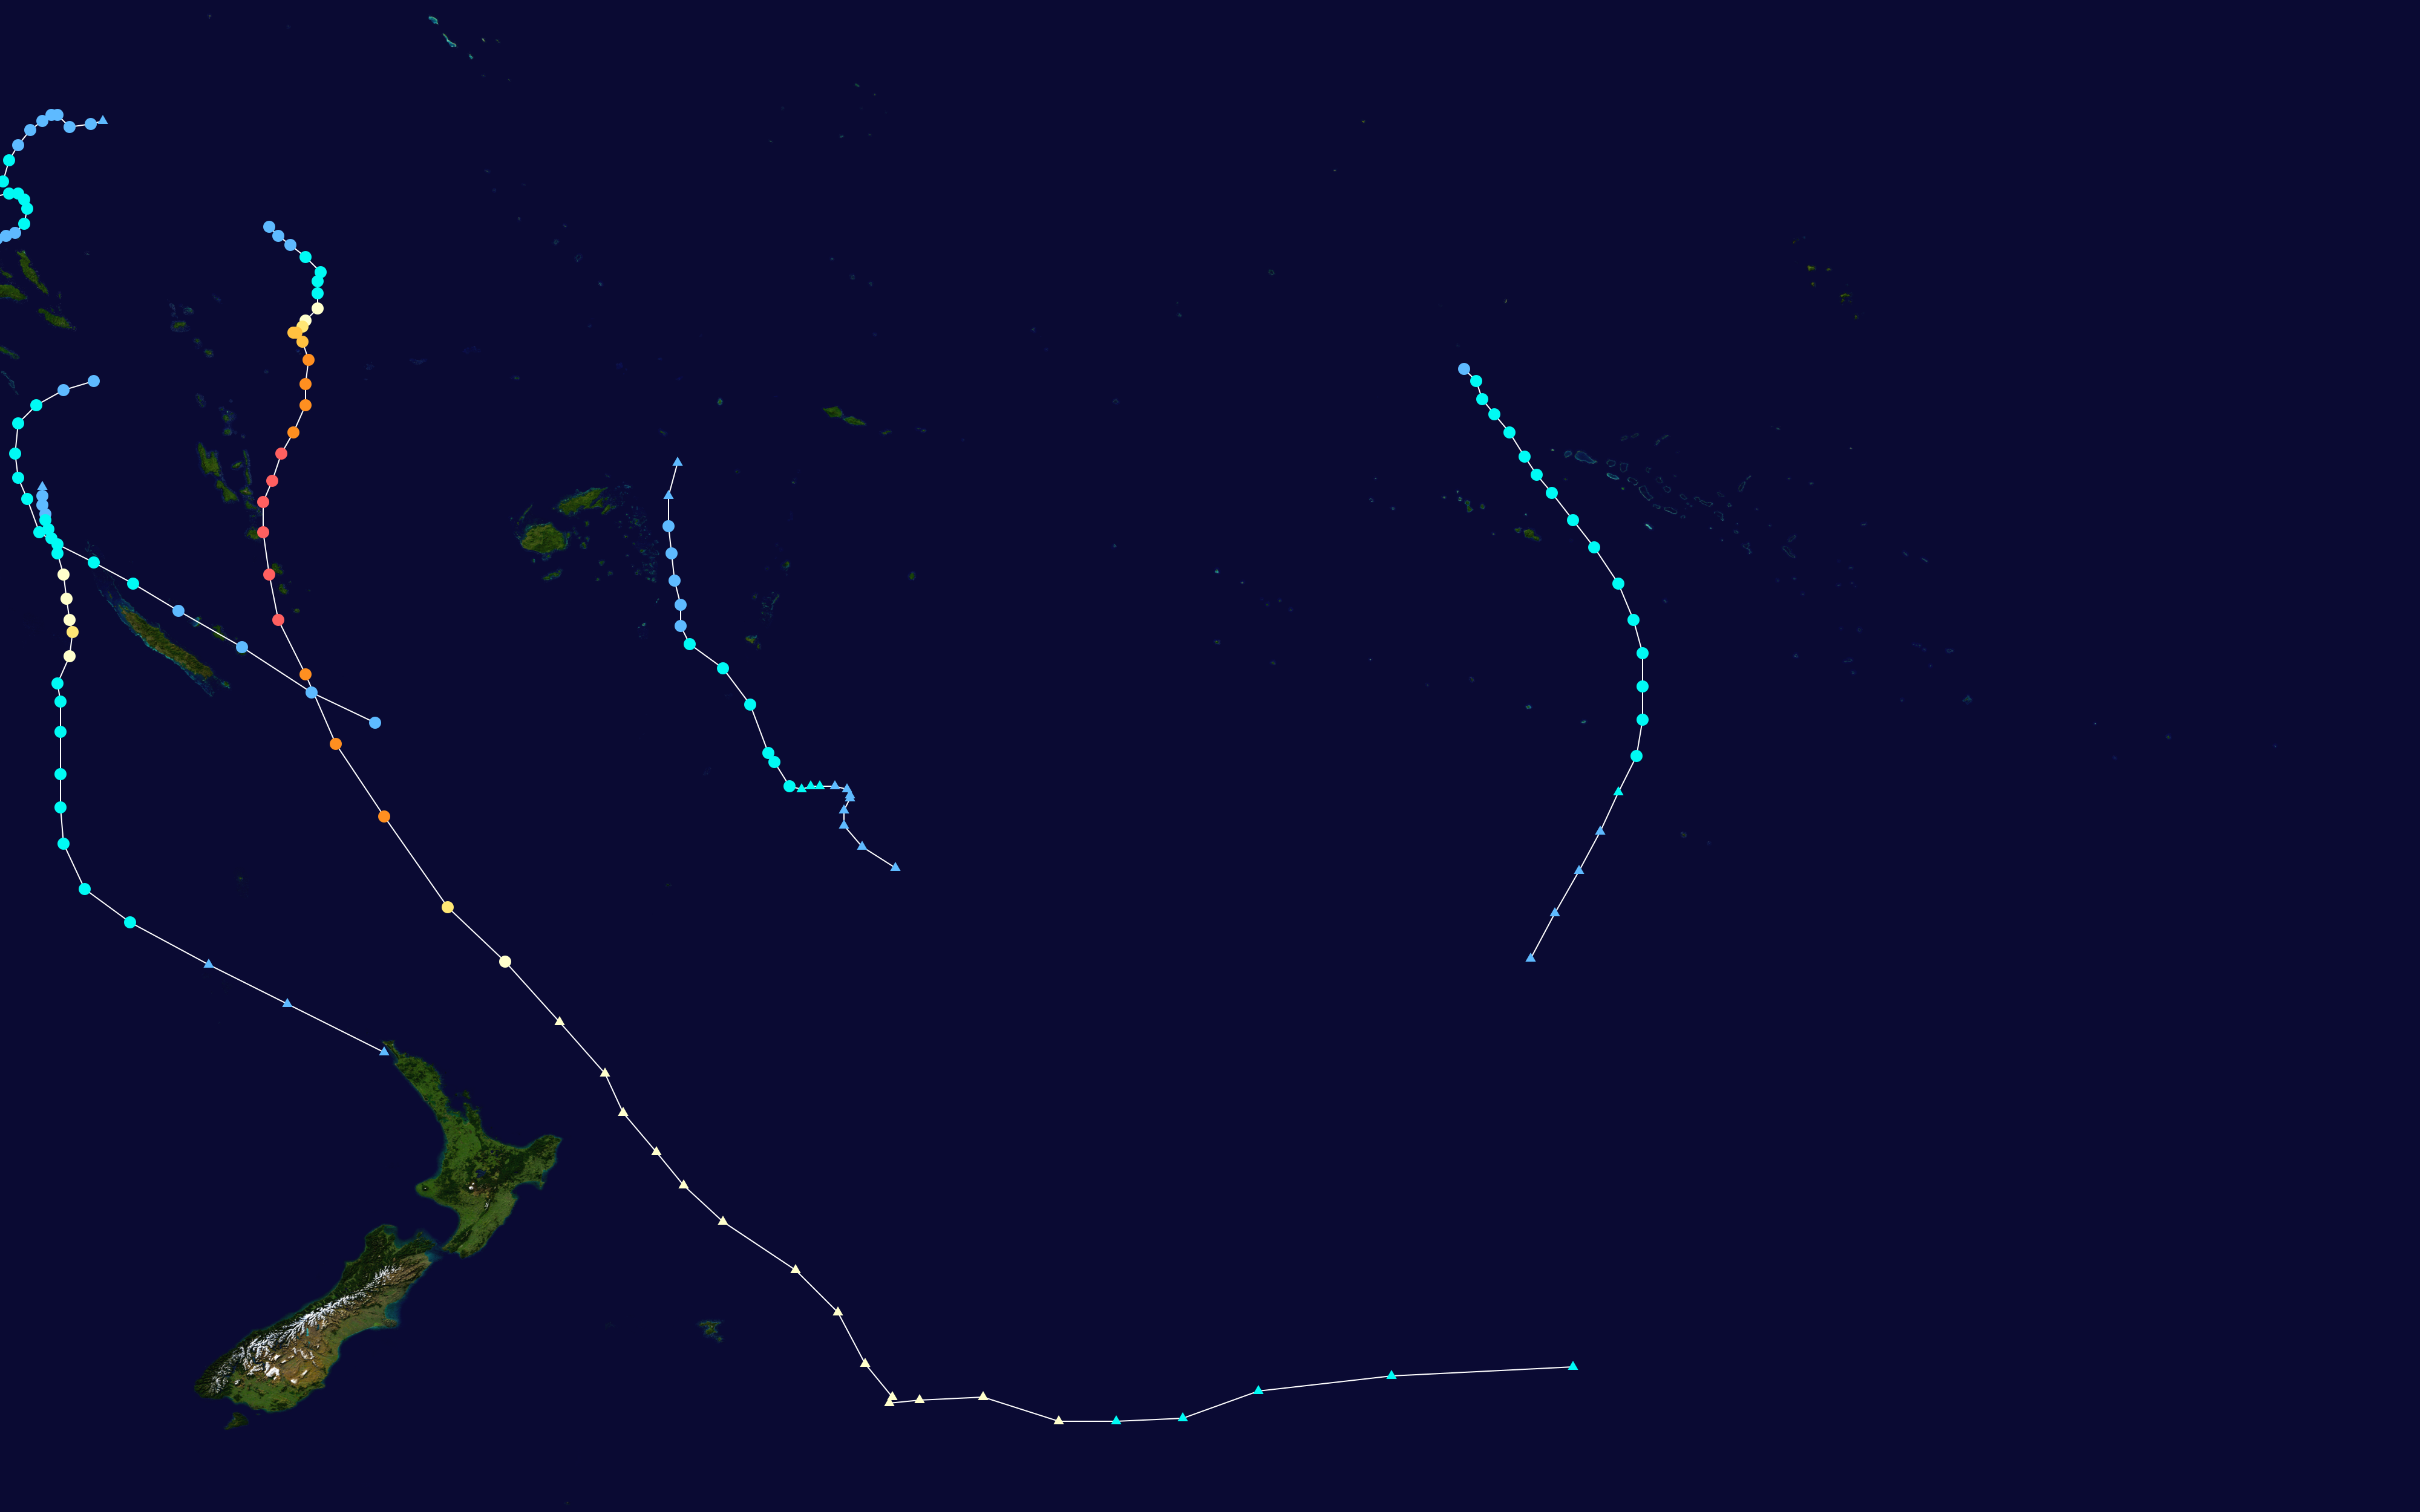
English: This map shows the tracks of all tropical cyclones in the 2014-15 South Pacific cyclone season. The points show the location of each storm at 6-hour intervals. The colour represents the storm's maximum sustained wind speeds as classified in the Saffir-Simpson Hurricane Scale (see below), and the shape of the data points represent the type of the storm.
Tropical depression (≤38 mph, ≤62 km/h)
Tropical storm (39–73 mph, 63–118 km/h)
Category 1 (74–95 mph, 119–153 km/h)
Category 2 (96–110 mph, 154–177 km/h)
Category 3 (111–129 mph, 178–208 km/h)
Category 4 (130–156 mph, 209–251 km/h)
Category 5 (≥157 mph, ≥252 km/h)
Unknown
Storm type |
| Bron | Created using Wikipedia:WikiProject Tropical cyclones/Tracks. The background image is from NASA [1]. The tracking data |
| Auteur | Keith Edkins |
| Dit werk vrijgegeven in het publieke domein door de auteur, Keith Edkins. Dit is wereldwijd van toepassing. In sommige landen is dit wettelijk niet mogelijk; in die gevallen geldt: Keith Edkins staat iedereen toe dit werk voor eender welk doel te gebruiken, zonder enige voorwaarden, tenzij zulke voorwaarden door de wet worden voorgeschreven. |
Bestandsgeschiedenis
Klik op een datum/tijd om het bestand te zien zoals het destijds was.
| Datum/tijd | Miniatuur | Afmetingen | Gebruiker | Opmerking | |
|---|---|---|---|---|---|
| huidige versie | 6 mrt 2020 09:57 | | 4.000 × 2.500 (533 kB) | Supportstorm | Best track update (removed minor systems without best track data) |
| 18 jan 2016 20:40 |  | 3.000 × 1.854 (484 kB) | Keith Edkins | Added Raquel, now considered to be part of this season. Northern edge changed to 2°S | |
| 14 apr 2015 08:37 |  | 3.000 × 1.854 (472 kB) | Keith Edkins | Added Solo | |
| 2 apr 2015 09:17 |  | 3.000 × 1.854 (461 kB) | Keith Edkins | Added 14F. Limits are <tt>--xmin 155 --xmax 245 --ymin -55 --ymax -10</tt> | |
| 25 mrt 2015 02:49 |  | 4.000 × 2.517 (541 kB) | Cyclonebiskit | update | |
| 12 feb 2015 11:07 |  | 3.000 × 1.854 (724 kB) | Keith Edkins | Add 08F, Ola, and 10F | |
| 28 jan 2015 11:09 |  | 3.000 × 1.854 (630 kB) | Keith Edkins | correction - remove dummy track west of date line | |
| 26 jan 2015 10:35 |  | 3.000 × 1.854 (697 kB) | Keith Edkins | Added Niko | |
| 31 dec 2014 13:22 |  | 3.000 × 1.854 (608 kB) | Keith Edkins | {{current}}{{Hurricane season auto track map|start=November 21, 2014|end=April 30, 2015|source=NRL|type=cyclone|basin=South Pacific|year=2014-15|author=Keith Edkins}} |
Bestandsgebruik
Dit bestand wordt op de volgende pagina gebruikt:
Globaal bestandsgebruik
De volgende andere wiki's gebruiken dit bestand:
- Gebruikt op de.wikipedia.org
- Gebruikt op en.wikipedia.org
- Gebruikt op ko.wikipedia.org
- Gebruikt op pt.wikipedia.org
- Gebruikt op vi.wikipedia.org
- Gebruikt op www.wikidata.org
- Gebruikt op zh.wikipedia.org