
Bestand:Tangent bundle.svg

Afmetingen van deze voorvertoning van het type PNG van dit SVG-bestand: 249 × 599 pixels Andere resoluties: 99 × 240 pixels | 199 × 480 pixels | 319 × 768 pixels | 425 × 1.024 pixels | 850 × 2.048 pixels | 400 × 963 pixels.
Oorspronkelijk bestand (SVG-bestand, nominaal 400 × 963 pixels, bestandsgrootte: 23 kB)
| Dit is een bestand van Wikimedia Commons. Onderstaande beschrijving komt van de beschrijving van het bestand daar. |
| Beschrijving |
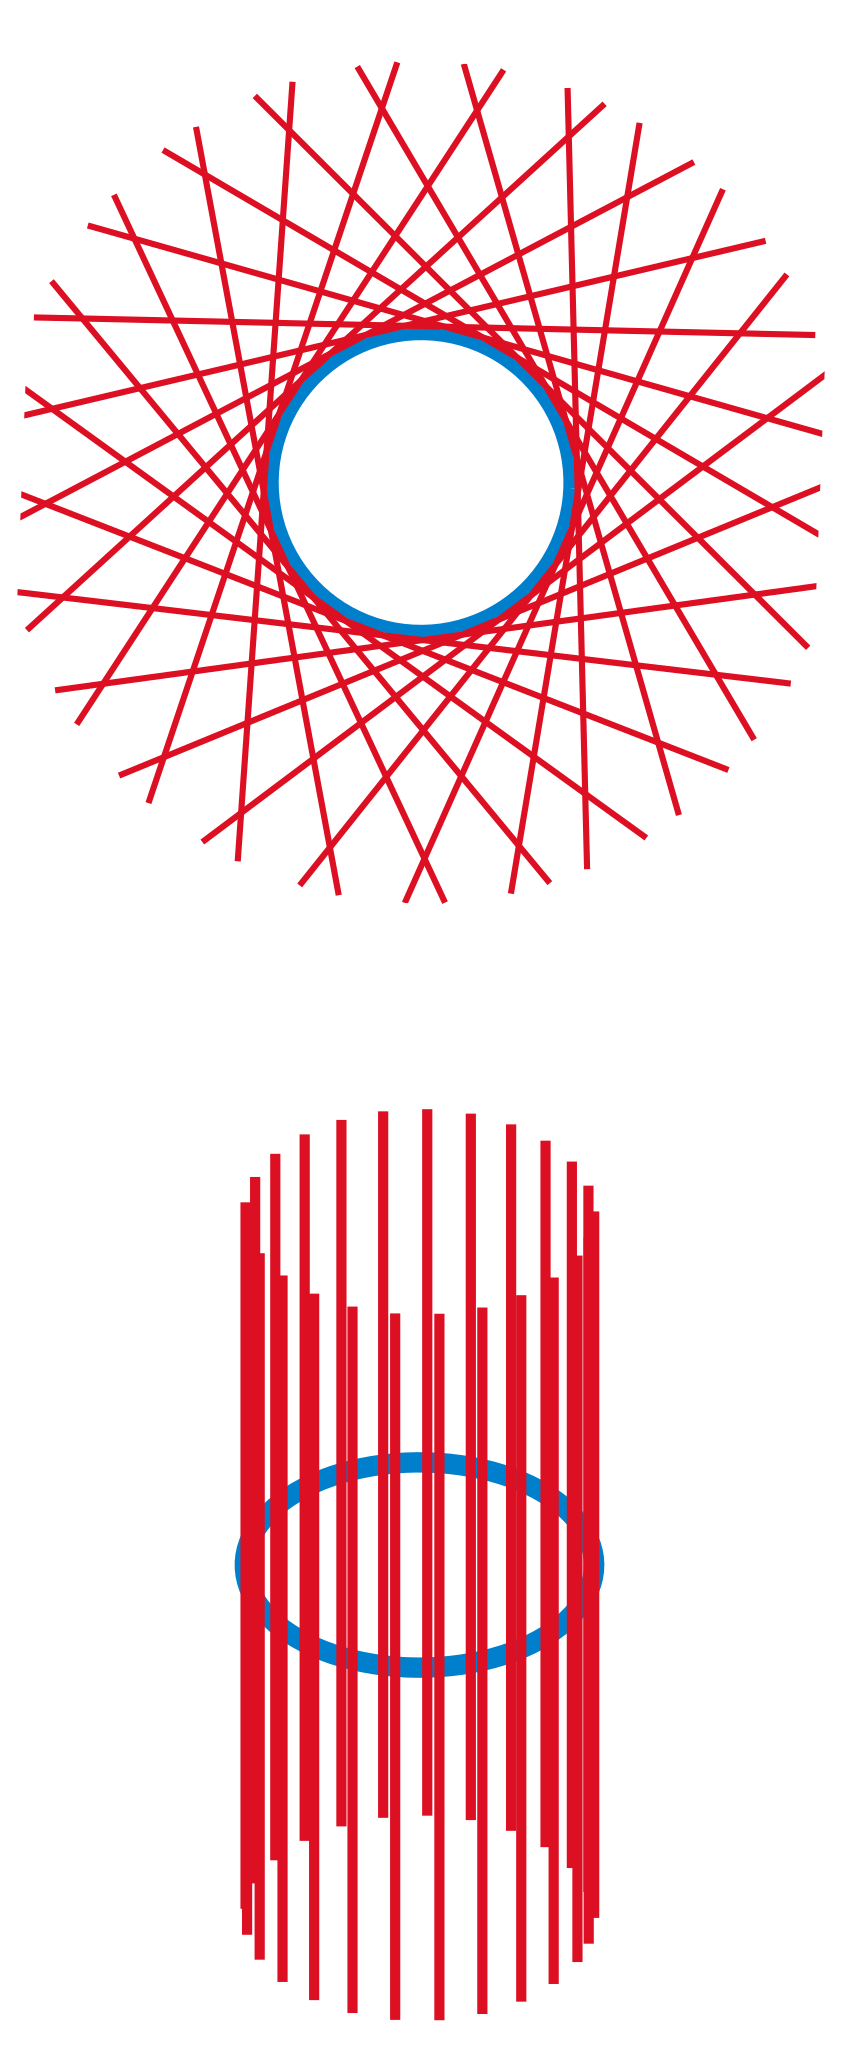
English: Illustration of Tangent bundle.
Deutsch: Die obere Grafik zeigt den Kreis mit einigen seiner Tangentialräume. Die zweite Grafik fasst die Tangentialräume zum Tangentialbündel zusammen. |
| Datum | (UTC) |
| Bron | self-made, with en:Matlab then tweaked with en:Inkscape |
| Auteur | Oleg Alexandrov |
| SVG ontwikkeling | |
| Broncode | MATLAB code% illustration of tangent bundle
function main()
a=0; b=2*pi; N = 100;
X=linspace(a, b, N);
Y=sin(X); % the function to plot
XT = 0*X+1;
YT = cos(X); % derivative
Theta = linspace(a, b, N);
X = cos(Theta); Y = sin(Theta);
XT = -sin(Theta); YT = cos(Theta);
ll = 2.5; % length of lines perpendicular to the curve
thin_line = 2;
thick_line = 4;
% will draw lines tangent to the graph of Y=f(X) at
% points separted by length of 'spacing'
spacing = 0.04;
M = floor(spacing*N);
% colors
red=[0.867 0.06 0.14];
blue = [0, 129, 205]/256;
green = [0, 200, 70]/256;
gray=0.8*[1, 1, 1];
figure(1); clf; hold on; axis equal; axis off;
figure(2); clf; hold on; axis equal; axis off; view(18, 36);
% plot the curve
figure(1); s=0.95; plot (s*X, s*Y, 'linewidth', thick_line, 'color', blue);
figure(2); plot3(X, Y, 0*X, 'linewidth', thick_line, 'color', blue);
% plot the lines
for k=1:N
p = (k-1)*M+2;
if p >= N
break;
end
figure(1);
x0 = X(p); y0=Y(p); mx = XT(p); my = YT(p);
plot([x0-mx*ll, x0+mx*ll], [y0-my*ll, y0+my*ll], 'color', red, 'linewidth', thin_line)
figure(2);
plot3([X(p), X(p)], [Y(p), Y(p)], [-ll, ll], 'color', red, 'linewidth', thin_line)
end
% save to disk as eps and svg
figure(1); saveas(gcf, 'Tangent_bundle1.eps', 'psc2'); plot2svg('Tangent_bundle1.svg')
figure(2); saveas(gcf, 'Tangent_bundle2.eps', 'psc2'); plot2svg('Tangent_bundle2.svg')
|
| Ik, de auteursrechthebbende van dit werk, geef dit werk vrij in het publieke domein. Dit is wereldwijd van toepassing. In sommige landen is dit wettelijk niet mogelijk; in die gevallen geldt: Ik sta iedereen toe dit werk voor eender welk doel te gebruiken, zonder enige voorwaarden, tenzij zulke voorwaarden door de wet worden voorgeschreven. |
Bestandsgeschiedenis
Klik op een datum/tijd om het bestand te zien zoals het destijds was.
| Datum/tijd | Miniatuur | Afmetingen | Gebruiker | Opmerking | |
|---|---|---|---|---|---|
| huidige versie | 12 jun 2007 06:08 | | 400 × 963 (23 kB) | Oleg Alexandrov | Tweak |
| 12 jun 2007 06:06 | 512 × 1.259 (23 kB) | Oleg Alexandrov | {{Information |Description=Illustration of en:Tangent bundle. |Source=self-made, with en:Matlab then tweaked with en:Inkscape |Date=~~~~~ |Author= Oleg Alexandrov }} {{PD-self}} Category:Differential geometry |
Bestandsgebruik
Dit bestand wordt op de volgende pagina gebruikt:
Globaal bestandsgebruik
De volgende andere wiki's gebruiken dit bestand:
- Gebruikt op da.wikipedia.org
- Gebruikt op de.wikipedia.org
- Gebruikt op de.wikiversity.org
- Kurs:Mathematik (Osnabrück 2009-2011)/Teil III/Vorlesung 79
- Mannigfaltigkeit/Tangentialbündel/Einführung/Textabschnitt
- Kurs:Analysis (Osnabrück 2013-2015)/Teil III/Vorlesung 78
- Kurs:Analysis (Osnabrück 2014-2016)/Teil III/Vorlesung 78
- Kurs:Analysis (Osnabrück 2014-2016)/Teil III/Vorlesung 78/kontrolle
- Kurs:Bündel, Garben und Kohomologie (Osnabrück 2019-2020)/Vorlesung 1
- Kurs:Bündel, Garben und Kohomologie (Osnabrück 2019-2020)/Vorlesung 1/kontrolle
- Mannigfaltigkeit/Tangentialbündel/Beispiel für reelle Vektorbündel/Einführung/Textabschnitt
- Kurs:Differentialgeometrie (Osnabrück 2023)/Vorlesung 10
- Kurs:Differentialgeometrie (Osnabrück 2023)/Vorlesung 10/kontrolle
- Kurs:Analysis (Osnabrück 2013-2015)/Teil III/Vorlesung 78/kontrolle
- Kurs:Mathematik (Osnabrück 2009-2011)/Teil III/Vorlesung 79/kontrolle
- Gebruikt op en.wikipedia.org
- Gebruikt op es.wikipedia.org
- Gebruikt op fr.wikipedia.org
- Gebruikt op it.wikipedia.org
- Gebruikt op ja.wikipedia.org
- Gebruikt op ko.wikipedia.org
- Gebruikt op pl.wikipedia.org
- Gebruikt op pt.wikipedia.org
- Gebruikt op ru.wikipedia.org
- Gebruikt op sv.wikipedia.org
- Gebruikt op uk.wikipedia.org
- Gebruikt op vi.wikipedia.org
- Gebruikt op www.wikidata.org