
Bestand:Global tropical cyclone tracks-edit2.jpg
Oorspronkelijk bestand (8.000 × 4.000 pixels, bestandsgrootte: 5,73 MB, MIME-type: image/jpeg)
| Dit is een bestand van Wikimedia Commons. Onderstaande beschrijving komt van de beschrijving van het bestand daar. |
| Saffir-Simpson Hurricane Scale | ||||||
| TD | TS | 1 | 2 | 3 | 4 | 5 |
| Beschrijving |
Čeština: Světové tropické cyklony v letech 1985 - 2005
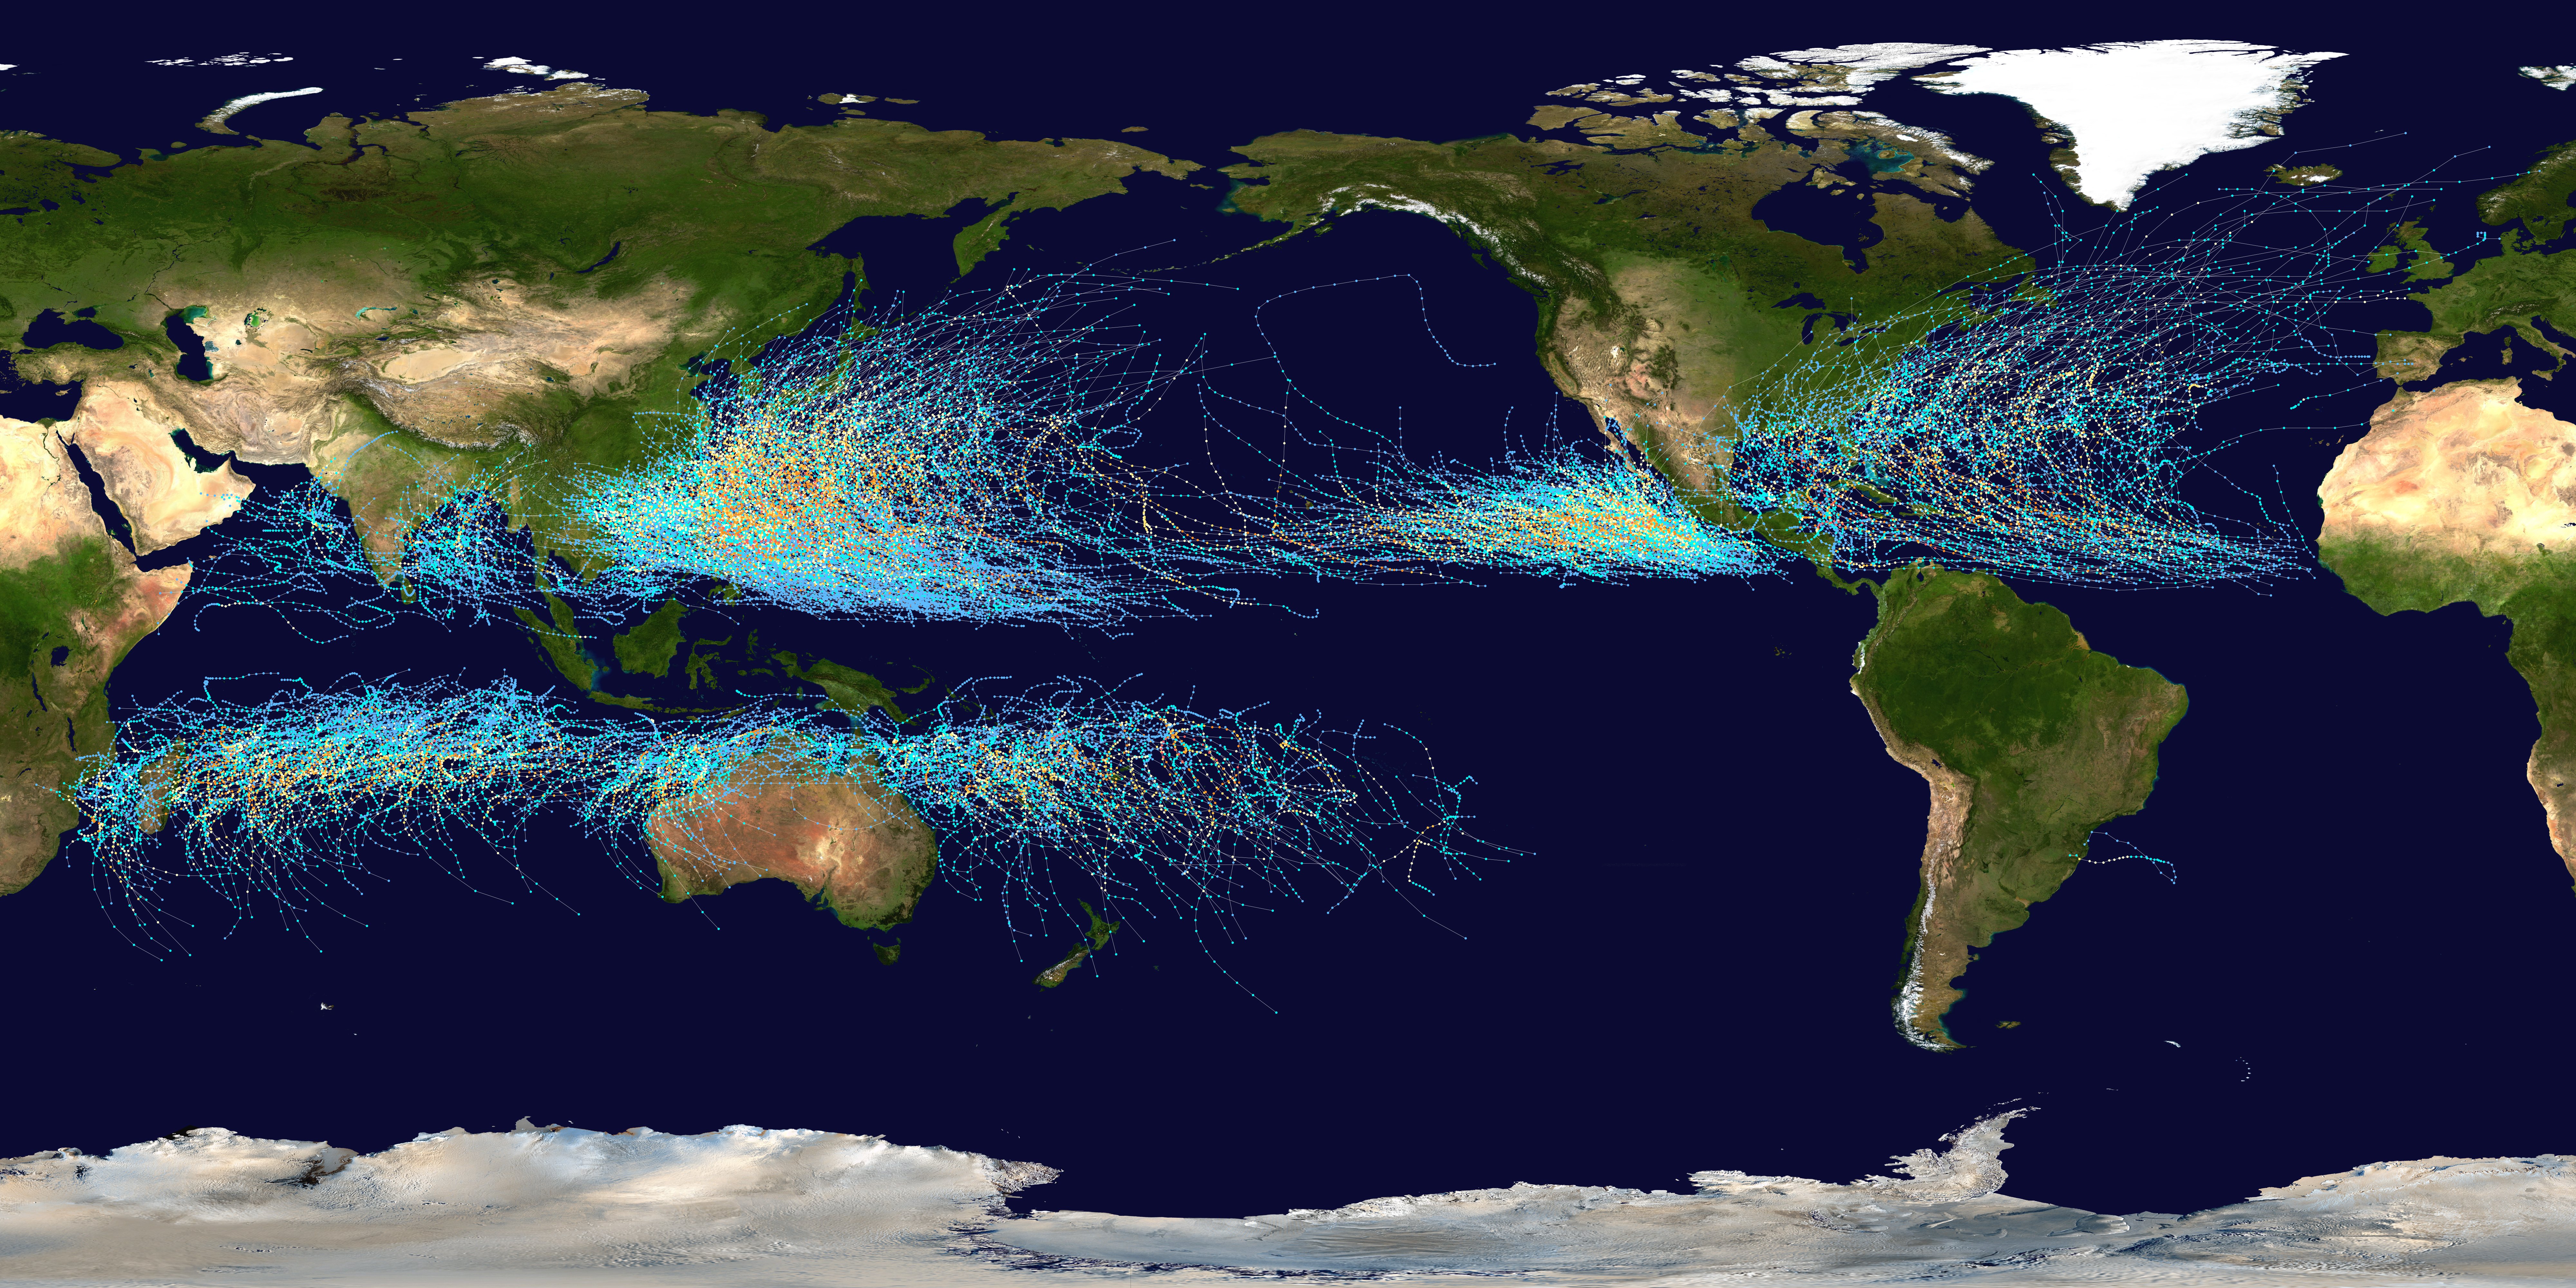
English: This map shows the tracks of all Tropical cyclones which formed worldwide from 1985 to 2005. The points show the locations of the storms at six-hourly intervals and use the color scheme shown to the right from the Saffir-Simpson Hurricane Scale. However, remnants of the storms are not shown as triangles.
Español: Este mapa muestra los recorridos de todos los ciclones tropicales, que se formaron desde 1985 hasta 2005. Los puntos muestran las localizaciones de las tormentas en intervalos de seis horas, y utilizan el esquema de color (a la derecha) de la Escala de huracanes de Saffir-Simpson.
Deutsch: Diese Karte zeigt die Verlaufsbahnen der Tropischen Wirbelstürme von 1985 bis 2005. Die farbigen Punkte zeigen die Positionen der Stürme in sechs-stündlichen Abständen und verdeutlichen die Intensität eines Sturmes zu diesen Zeitpunkten auf der Saffir-Simpson-Hurrikan-Skala.
Français : Cette carte montre les traces de tous les cyclones tropicaux qui se sont formés entre 1985 et 2005. Les points montrent l'emplacement des cyclones à des intervalles de six heures, et leur couleur indique leur intensité sur l'échelle de Saffir-Simpson.
Português: Esse mapa mostra as rotas de todos os ciclones tropicais que se formaram entre 1985 e 2005. Os pontos indicam suas localizações, registradas a cada seis horas. O esquema de cores ao lado é baseado na escala Saffir-Simpson.
Tagalog: Ang mapang ito ay nagpapakita ng dinaanan ng mga bagyo sa buong mundo mula 1985 hanggang 2005. Ang mga tuldok ay nagpapakita ng galaw ng bagyo kada anim na oras. Makikita rin ang ibat-iang kulay ng bawat linya na magbibigay impormasyon sa lakas o hina ng isang isang bagyo sa pamamagitan Saffir-Simpson Hurricane Scale.
Türkçe: Bu harita, 1985 ile 2005 yıları arasında dünyada meydana gelen tüm tropik kasırgaların hareketlerini göstermektedir. Her bir nokta altı saatlik aralarla kasırganın yerini, kullanılan renkler ise kasırgaların, Saffir-Simpson ölçeğine göre şiddetlerini gösterir.
Русский: На этой карте показаны пути всех тропических циклонов за 1985-2005 гг. На каждом пути точки соответствуют положениям циклона через каждые 6 часов; их цвет указывает силу циклона по шкале Саффира-Симпсона
Slovenčina: Táto mapa ukazuje trasy všetkých tropických cyklónov, ktoré sa vytvorili po celom svete v rokoch 1985 až 2005. Body ukazujú umiestenie búrky v šesťhodinových intervaloch a používajú farebnú škálu zobrazenú vpravo podľa Saffirovej-Simpsonej hurikánovej stupnice.
中文:此地圖展示自1985年至2005年間世界各地熱帶氣旋分佈及路徑。路徑以每6小時為一點,並按薩菲爾-辛普森颶風等級(Saffir-Simpson Hurricane Scale)分為不同顏色。 |
||
| Datum | |||
| Bron |
Created using User:jdorje/Tracks by Nilfanion on 2006-08-05. Background image from File:Whole_world_-_land_and_oceans.jpg (NASA). Tracking data for storms within the Atlantic and Eastern Pacific basins is taken from the National Hurricane Center and the Central Pacific Hurricane Center's Northeast and North Central Pacific hurricane database. The tracking data for storms within the Indian Ocean, the Northwest Pacific and the Southern Pacific is from the Joint Typhoon Warning Center. Tracking data for Cyclone Catarina in the South Atlantic was published in Gary Padgett's April 2004 Monthly Tropical Cyclone Summary and was originally produced by Roger Edson of the University of Guam. |
||
| Auteur | |||
| Toestemming (Hergebruik van dit bestand) |
|
Used within
Mogil, H. Michael. Extreme Weather: Understanding the Science of Hurricanes, Tornadoes, Floods, Heat Waves, Snow Storms, Global Warming and Other Atmospheric Disturbances, pp. 61. (Hardcover - Nov 13, 2007)
Awards
|

Deze afbeelding is geselecteerd als afbeelding van de dag op 6 januari 2007. De afbeelding heeft de volgende beschrijving: English: Worldwide Tropical cyclones from 1985 to 2005 Andere talen:
閩南語 / Bân-lâm-gú: Ùi 1985 nî kàu 2005 nî choân-sè-kài ê jia̍t-tāi kē-khì-ap. Čeština: Světové tropické cyklony v letech 1985 - 2005 Dansk: Kort over tropiske cykloner mellem 1985 og 2005. Deutsch: Die Verlaufsbahnen der Tropischen Wirbelstürme von 1985 bis 2005 English: Worldwide Tropical cyclones from 1985 to 2005 Español: Mapa mundial de ciclones tropicales entre los años 1985 y 2005. Français : Carte des cyclones tropicaux entre 1985 et 2005 Italiano: Mappa mondiale dei cicloni tropicali dal 1985 al 2005. Magyar: Világméretű tropikus ciklonok 1985-től 2005-ig Polski: Mapa cyklonów tropikalnych na świecie w latach 1985-2005 Sicilianu: Mappa munniali dê cicluna trupicali dô 1985 ô 2005. Svenska: Karta över tropiska cykloner mellan 1985 och 2005. Български: Карта на тропическите циклони в световен мащаб от 1995 г. до 2005 г. Русский: Карта тропических циклонов 1985-2005 годов. 日本語: 1985年から2005年までの熱帯低気圧 中文: 1985年至2005年的热带气旋分布 中文(繁體): 1985年至2005年世界各地的熱帶氣旋分佈圖 |

|
Deze afbeelding is beoordeeld op basis van de criteria voor waardevolle afbeeldingen en wordt beschouwd als de meest waardevolle afbeelding op Commons binnen het onderwerpgebied: Global cumulative tropical cyclone tracks. Deze nominatie kan bekeken worden op Commons:Valued image candidates/Global tropical cyclone tracks-edit2.jpg. |
Bestandsgeschiedenis
Klik op een datum/tijd om het bestand te zien zoals het destijds was.
| Datum/tijd | Miniatuur | Afmetingen | Gebruiker | Opmerking | |
|---|---|---|---|---|---|
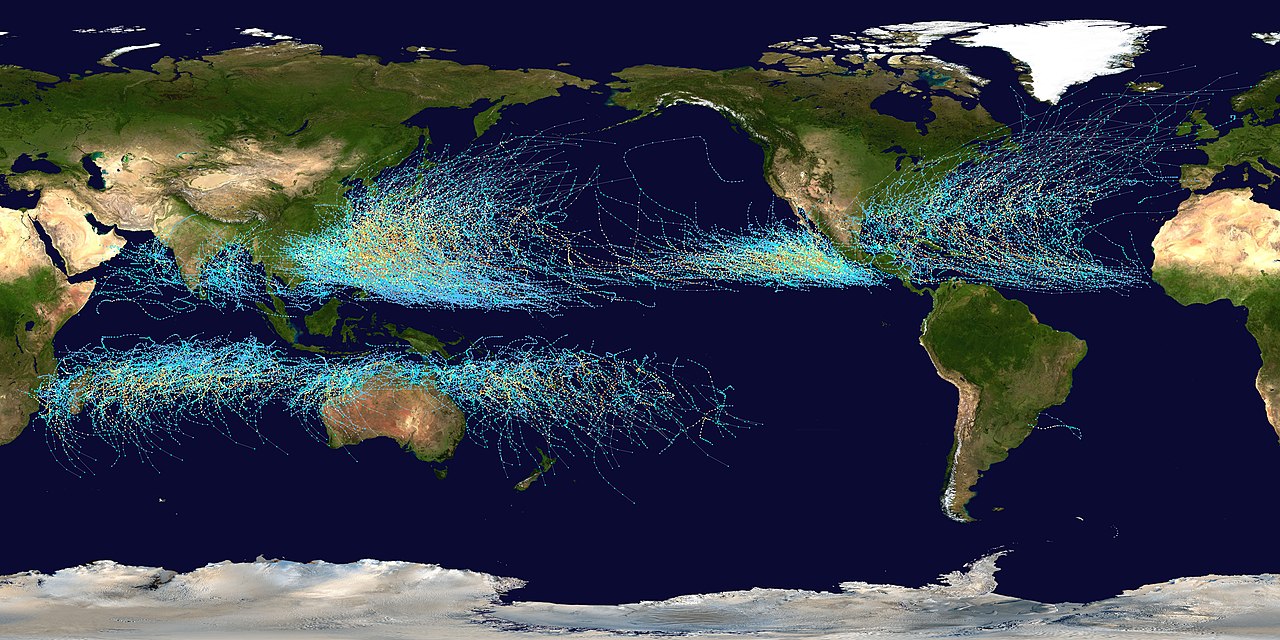
| huidige versie | 19 mrt 2020 14:10 | | 8.000 × 4.000 (5,73 MB) | Supportstorm | Reverted to version as of 00:36, 5 August 2006 (UTC) |
| 27 feb 2020 03:40 |  | 1.920 × 960 (482 kB) | JDD Sicko | ok some body update this its almost 15 years old * also i made no changes * | |
| 5 aug 2006 02:36 |  | 8.000 × 4.000 (5,73 MB) | Nilfanion | == Summary == This map shows the tracks of all Tropical cyclones which formed worldwide from 1985 to 2005. The points show the locations of the storms at six-hourly intervals and use the color scheme from [[w:Saffir-Simpson Hurrican |
Bestandsgebruik
Dit bestand wordt op de volgende 2 pagina's gebruikt:
Globaal bestandsgebruik
De volgende andere wiki's gebruiken dit bestand:
- Gebruikt op af.wikipedia.org
- Gebruikt op als.wikipedia.org
- Gebruikt op ar.wikipedia.org
- إعصار قمعي
- عاصفة ثلجية
- خريف
- شتاء
- مناخ
- علم الأرصاد الجوية
- ثلج
- سحاب
- صيف
- تلوث الهواء
- مطر
- ربيع
- فصول السنة
- فيزياء الغلاف الجوي
- برد (هطول)
- عاصفة رملية
- ضباب
- موسم جاف
- موسم رطب
- عاصفة رعدية
- إعصار استوائي
- توقع جوي
- نيزك جليدي ضخم
- قالب:طقس
- السحابة الخارقة
- هبوب
- دمق
- مناخ أصغري
- هرمتان (رياح)
- شاهقة مائية
- انقلاب صيفي
- غبار الألماس
- برد دقيق
- مطر متجمد
- حبيبات جليدية
- رذاذ متجمد
- مزن ركامي
- عاصفة جليدية
- موجة حر
- موجة برد
- عاصفة نارية
- خليط المطر والثلج
- انقلاب شتوي
- طقس قاسي
- استطلاع الطقس
- رذاذ
- حبيبات ثلجية
Globaal gebruik van dit bestand bekijken.